Bridge output & heating
6.00 mV
Estimated one-sided full-scale signal at the bridge.
71.4 mW/bridge; 428.6 mW across six bridges. Temperature rise and warm-up time: unknown until measured.
ENGINEERING CALCULATOR + DECISION GUIDE
Estimate excitation, gain, cable loss and sampling limits for six raw bridge channels. Review assumptions before selecting hardware.
By HexaForce · Published · Reviewed . This guide covers raw mV/V bridges. For conditioned ±5 V or ±10 V outputs, start with the interface overview and the supplier’s output scaling.
Estimate gain, heating, cable drop and timing. All fields are required; defaults are illustrative.
ILLUSTRATIVE DEFAULT PREVIEW · PRELIMINARY ESTIMATES
Estimated one-sided full-scale signal at the bridge.
71.4 mW/bridge; 428.6 mW across six bridges. Temperature rise and warm-up time: unknown until measured.
Gain sized from nominal excitation; estimated ADC peak 1.667 V out of ±2.5 V.
0.833 V (33.3%) unused peak range. Confirm bridge offset, tool tare and all six raw-channel peaks.
Nyquist boundary versus 50 Hz highest selected baseband component.
0.0 µs endpoint skew, 0.00° in the ideal timing model. Simultaneous mode assumes zero skew; actual aperture mismatch and filter delay are unverified.
Ideal regulated attenuation; residual error is unknown.
Loop 1.34 Ω; load 350.00 Ω. Bridge 5.000 V; lead drop 0.019 V; required source 5.019 V. Verify driver current and compliance.
Bridge Johnson noise at 300 K, ideal bandwidth 500 Hz. ADC code step 0.298 µV at ADC input.
Ideal nominal-load sine SNR 97.9 dB includes bridge and quantization noise only. AFE, ADC internal noise, EMI, drift and matrix noise gain excluded. Measured ENOB and force resolution: unknown.
Frame period. A direct 6×6 matrix-vector product needs 36 multiplies + 30 additions: 66.0 k arithmetic operations/s.
Execution time, CPU margin and transport delay are unknown. Measure worst-case acquisition-to-output latency on your target hardware.
Ratiometric: cancellation assumes the reference tracks actual bridge excitation with suitable scaling, bandwidth and input limits. Residual error is unknown.
Model: six identical full bridges, 0.134 Ω/m conductors, ideal active regulation for 6-wire mode, uniform scans for multiplexed mode. No tested device compatibility or safety approval is implied. Review formulas and evidence.
Engineering review: 2 November 2026. All examples are calculations, not measured results or approved product configurations. The report below uses fixed illustrative examples, independent of your submitted tool inputs.
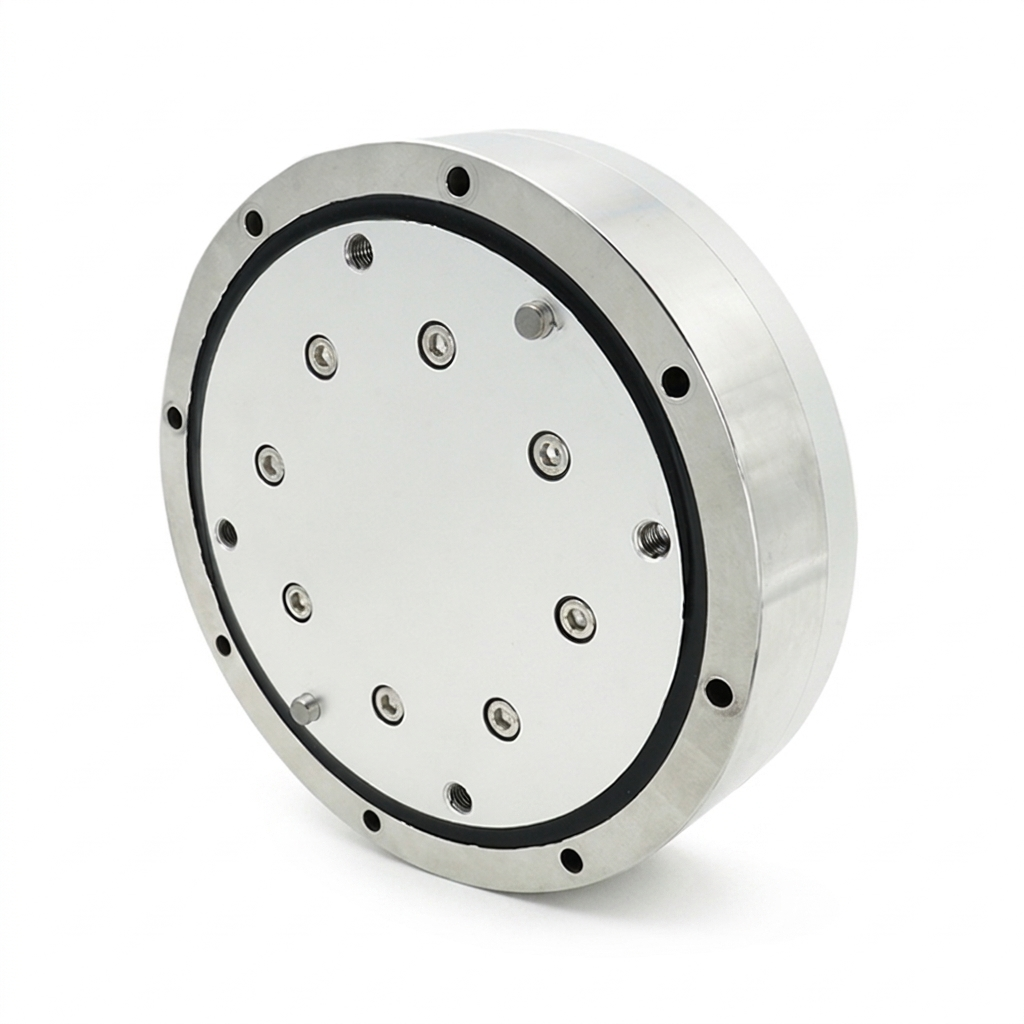
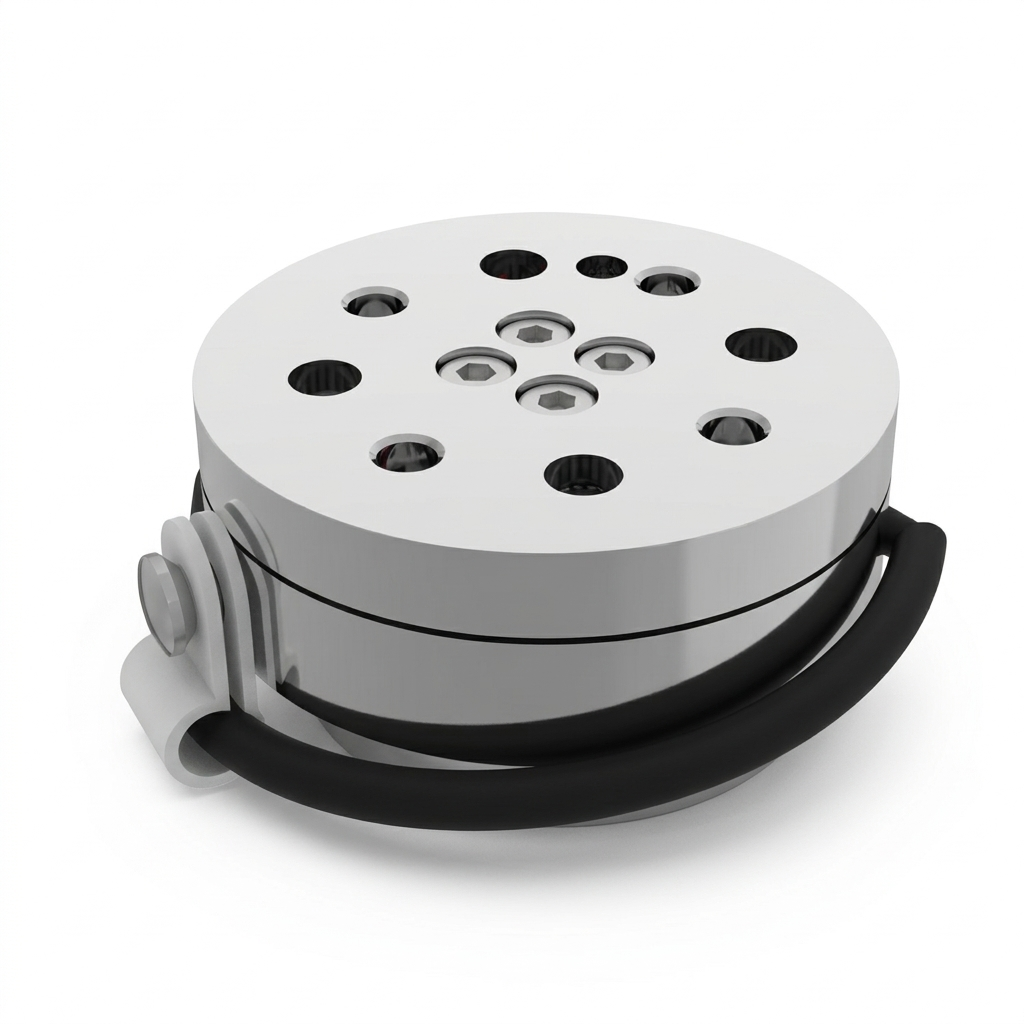
Use the package references to discuss connector access, cable routing and the location of signal conditioning. They illustrate geometry only; an exterior photo cannot establish raw-bridge output, pinout, ADC architecture or a calibration rating.
Request the electrical block diagram and serial-linked calibration record before choosing between a remote DAQ and near-sensor electronics.
| Decision | Actionable conclusion | Evidence / limit |
|---|---|---|
| Excitation | Calculate the heat budget before increasing bridge voltage. | P = V²/R; default six-bridge estimate is 428.6 mW. Temperature and drift require a test. |
| Gain | Keep nominal signal below the ADC peak limit and check raw-channel peaks. | Default target 277.8×; derived in gain sizing. Mechanical overload remains separate. |
| Sampling | Resolve both signal bandwidth and channel alignment. | ADI MT-002 sampling tutorial; actual scan and filter delays must be measured. |
| Cabling | Confirm whether bridges share an excitation pair. | NI remote sensing manual explains lead-drop correction; our load model is explicit below. |
| Release | Treat sizing as a test plan, with supplier evidence still required. | Use the acceptance checklist; no calculator status certifies hardware. |
The model contains six identical full bridges with one raw differential channel per bridge. Excitation is a DC magnitude, sensitivity is the one-sided rated bridge output in mV/V, ADC range is a symmetric differential peak limit, and sample rate means frames per second with one sample per channel per frame. Individual bridges may respond to multiple mechanical axes; raw channels are not automatically Fx through Mz.
This is a baseband planning model. It excludes bridge imbalance, unequal sensitivities, AFE offset/common-mode limits, connector resistance, wire heating, source impedance, actual filter response and the calibration matrix. A conditioned voltage-output sensor needs its own scaling model. For circuit architectures and constraints see the TI bridge measurement guide.
| Quantity | Formula | Meaning / assumption |
|---|---|---|
| Bridge signal | Vsig [mV] = Vsensor [V] × S [mV/V] | Rated one-sided output; actual combined-load raw peaks can differ. |
| Heat | P6 [mW] = 6 × Vsensor² / Rbridge × 1000 | Six identical loads; this is electrical dissipation, not a drift prediction. |
| Lead loop | Rloop = 2 × L × 0.134 Ω/m | One-way cable length L; illustrative conductor resistance. |
| Cable load | Rload = Rbridge (independent) or Rbridge/6 (shared) | One current loop per bridge versus one common current loop. |
| 4-wire voltage | Vsensor = Vsource × Rload/(Rload + Rloop) | Uncompensated excitation. Gain is sized using nominal excitation. |
| Ideal regulated voltage | Vsensor = Vset; Vsource = Vset + (Vset/Rload)Rloop | Active 6-wire model; source compliance and residual error unknown. |
| Gain | G = A / (M × Vsig,nominal) | A is positive ADC peak voltage; signal converted to volts. |
| Uniform scan skew | Δt = 5/(6fs); Δφ = 360fΔt | Six conversions spread uniformly across a frame; not every MUX schedule. |
The 0.5% cable-loss, 500 mW heating and 10× sampling-ratio flags are editorial review triggers. They are not manufacturer ratings or universal acceptance criteria. Every configuration retains unverified hardware requirements.
Use the voltage approved for the actual bridge and electronics. Raising excitation increases signal linearly and dissipation quadratically at fixed resistance. The examples below assume ideal voltage at each of six 350 Ω bridges; power excludes excitation-wire losses. A compact sensor and a large balance can have very different thermal resistance at the same power.
| Excitation at bridge | Per bridge | All six bridges | What remains unknown |
|---|---|---|---|
| 2.5 V | 17.9 mW | 107.1 mW | Temperature rise, warm-up time, thermal gradients and zero drift: measure on the installed assembly. |
| 3.3 V | 31.1 mW | 186.7 mW | Temperature rise, warm-up time, thermal gradients and zero drift: measure on the installed assembly. |
| 5 V | 71.4 mW | 428.6 mW | Temperature rise, warm-up time, thermal gradients and zero drift: measure on the installed assembly. |
| 10 V | 285.7 mW | 1714.3 mW | Temperature rise, warm-up time, thermal gradients and zero drift: measure on the installed assembly. |
Do not infer a safe excitation limit from this table. Ask for maximum excitation, input resistance tolerance and zero/span temperature coefficients. Record cold-start zero and ambient temperature with the intended mounting, then choose a warm-up/tare procedure from the observed settling. Do not add interface paste or insulating spacers without checking mounting and calibration requirements.
For the default 5 V, 1.2 mV/V bridge, nominal full-scale output is 6 mV. Mapping that through a 1.5× allowance into ±2.5 V gives G = (2.5/1.5)/0.006 = 277.8×. Nominal ADC peak is 1.667 V, leaving 0.833 V, or 33.3% of the positive peak range. These numbers do not account for bridge zero offset or combined loading.
Check both polarities of every raw channel under maximum expected tool tare, acceleration and applied wrench. A digital tare after the ADC cannot recover clipping that happened earlier. Confirm amplifier input common mode, output swing, supplies, gain-bandwidth and settling before interpreting the arithmetic gain as realizable.
The generic ±2.5 V calculator setting is not an ADS131M06 preset. That device is a six-channel simultaneous 24-bit converter with its own reference, PGA and input constraints; inspect those conditions before connecting a bridge or external amplifier. No compatibility test is claimed. TI ADS131M06 datasheet.
For the selected baseband model, the highest relevant component must be strictly below fs/2. Equality is rejected because arbitrary phase cannot be recovered reliably at the boundary. A real anti-alias filter also needs transition bandwidth; the inequality alone does not establish adequate attenuation. ADI MT-002 sampling tutorial.
| Frames/s (samples/s/channel) | Ch1-to-Ch6 skew | Phase at 20 Hz | Phase at 50 Hz |
|---|---|---|---|
| 100 | 8333.3 µs | 60.00° | 150.00° — at Nyquist; rejected |
| 500 | 1666.7 µs | 12.00° | 30.00° |
| 1000 | 833.3 µs | 6.00° | 15.00° |
| 4000 | 208.3 µs | 1.50° | 3.75° |
| 10000 | 83.3 µs | 0.60° | 1.50° |
A 1 kHz frame rate means 6,000 conversions/s in this uniform-scan example, giving 833.3 µs endpoint skew and 15° at 50 Hz. A burst scan can be much shorter; delta-sigma channel switching can instead require additional settling. Use actual device timing. The phase value alone cannot predict off-axis force or controller stability without signal amplitudes, matrix coefficients and the full control-loop model.
Simultaneous acquisition reduces one source of mismatch; common filter configuration and clocking still matter. Multiplexing may be acceptable for slow signals with a proven error budget. Do not treat it as universally invalid or simultaneous sampling as zero-error measurement.
Choose filters by passband amplitude error, stopband rejection, group delay and settling. Bessel, Butterworth and sinc filters offer different tradeoffs; neither a filter family nor a nominal sample rate guarantees contact stability. Evaluate analog and converter digital filters together, then measure end-to-end latency under load.
A 5 m harness at the assumed 0.134 Ω/m has a 1.34 Ω round-trip excitation resistance. That produces about 0.38% uncompensated drop for one 350 Ω load, versus about 2.25% when six such bridges share one pair. The wiring drawing determines which model applies.
| One-way length | Loop Ω | Independent loops: attenuation | One shared pair: attenuation |
|---|---|---|---|
| 1 m | 0.27 | 0.08% | 0.46% |
| 5 m | 1.34 | 0.38% | 2.25% |
| 10 m | 2.68 | 0.76% | 4.39% |
| 20 m | 5.36 | 1.51% | 8.42% |
| 50 m | 13.40 | 3.69% | 18.68% |
Six-wire sensing can feed a voltage regulator or the measurement reference; these are distinct implementations. The tool specifically assumes active regulation. Confirm source compliance/current and sense-loop behavior, then measure residual error. A remote sense pair does not imply unlimited cable length or a measured 0.00% loss. NI remote sensing manual.
Ratiometric cancellation assumes the reference follows the actual bridge excitation with compatible scaling and dynamics. An independent reference retains excitation drift as a gain term. Because drift/noise transfer data are not inputs here, the reference selector changes the review advice rather than inventing a numerical improvement. TI bridge measurement guide.
The calculator uses ebridge = √(4kTRB), T = 300 K and ideal brick-wall B = fs/2. For equal full-bridge arms and a low-impedance excitation source, differential output resistance equals the arm resistance. Real excitation impedance and bridge topology can change this. At the default 350 Ω and 500 Hz bandwidth, the estimate is 0.054 µV RMS at the bridge.
For a bipolar ±A ADC, code step q = 2A/2ᴺ and ideal quantization RMS is q/√12. The displayed ideal SNR is 20 log₁₀[(Vpeak/√2)/√((G·ebridge)² + q²/12)], using a nominal-load sine and the modeled cable voltage. Quantization noise is a statistical idealization; a real converter must be characterized. ADI ADC noise definitions.
| Term | In this tool? | Required release evidence |
|---|---|---|
| Bridge thermal noise | Ideal estimate at 300 K, bandwidth fs/2 | Actual temperature, output impedance and noise-equivalent bandwidth |
| ADC code step | Ideal 2A/2ᴺ | Configured range, gain, data format and ADC internal noise |
| AFE / reference / EMI | Unknown; excluded | Input-referred noise spectrum, drift and installed noise capture |
| Force/torque resolution | Unknown; no N or N·m claim | Calibration matrix and output noise covariance, with stated filtering |
| Measured ENOB / accuracy | Unknown; not reported as calculated performance | Measured SINAD for ENOB; calibration and uncertainty budget for accuracy |
To compare two chains, capture equal-duration unloaded data at the same bandwidth and temperature. Report raw and decoupled RMS noise, peak-to-peak behavior, drift and filtering separately. A 24-bit data word does not establish 24 effective bits or any specific force resolution.
Apply the supplied calibration convention: W = C(S − S₀). S may be volts, mV/V or ADC codes depending on the calibration record; C must match that convention. Preserve serial number, revision, channel order, sign, coordinate frame and force/torque units. Changing excitation or gain may invalidate a voltage-based matrix.
A direct 6×6 matrix-vector product requires 36 multiplies and 30 additions per frame, excluding zero subtraction, filtering and diagnostics. At 1 kHz this is 66,000 arithmetic operations/s and a 1,000 µs frame period. These counts do not determine MCU execution time: compiler, clock, arithmetic, memory access and interrupt load must be specified and measured.
If output torques are divided by a declared characteristic length L, define D = diag(1,1,1,1/L,1/L,1/L). Since the output is W = CS, normalized output is Wn = DW and Cn = DC. Scaling acts on output rows. Changing input normalization requires a separate right-side transform. Declare both scales before comparing condition numbers; no universal threshold certifies sensor geometry.
For a linear model, output noise covariance is ΣW = CΣSCᵀ. This directly connects measured channel noise to output uncertainty. A small condition number alone does not set absolute noise gain, residual crosstalk or accuracy; retain calibration residuals and uncertainty evidence.
These are hypothetical input sets. Each link loads the exact preset into the calculator; all outcomes below are arithmetic or required verification, not observed device performance.
Premise: A wrist measurement chain targets 50 Hz baseband at 1 kHz frames/s.
Process: Vexc 5 V; Rbridge 350 Ω; sensitivity 1.2 mV/V; ±2.5 V ADC; 1.5× multiplier.
Calculated result: 6.00 mV signal; 277.8× gain; 428.6 mW heating; 0.0 µs modeled skew; source requirement 5.019 V.
Next: Check raw-channel peaks under the actual tool tare, then measure filter and transport delay.
Load and inspect this example ↗Premise: A smaller signal budget is explored with 2.5 V excitation, 0.8 mV/V sensitivity and 2 kHz frames/s.
Process: Vexc 2.5 V; Rbridge 350 Ω; sensitivity 0.8 mV/V; ±1.25 V ADC; 2× multiplier.
Calculated result: 2.00 mV signal; 312.5× gain; 107.1 mW heating; 0.0 µs modeled skew; source requirement 2.504 V.
Next: Compare the lower electrical heating against measured AFE noise. Temperature rise and mN resolution remain unknown.
Load and inspect this example ↗Premise: A 20 m shared excitation pair supplies six 1,000 Ω bridges at an ideal regulated 10 V.
Process: Vexc 10 V; Rbridge 1000 Ω; sensitivity 2 mV/V; ±5 V ADC; 1.2× multiplier.
Calculated result: 20.00 mV signal; 208.3× gain; 600.0 mW heating; 0.0 µs modeled skew; source requirement 10.322 V.
Next: Confirm the source can provide the required current and voltage; evaluate thermal behavior on the installed balance.
Load and inspect this example ↗Premise: A 1 kHz uniform sequential scan is evaluated at 50 Hz with a 10 m 4-wire cable.
Process: Vexc 5 V; Rbridge 350 Ω; sensitivity 1.2 mV/V; ±2.5 V ADC; 1.5× multiplier.
Calculated result: 5.95 mV signal; 277.8× gain; 422.1 mW heating; 833.3 µs modeled skew; source requirement 5.000 V.
Next: Compare phase error to the permitted budget and include cable attenuation in calibration. Evaluate a faster scan or simultaneous ADC.
Load and inspect this example ↗| Architecture | Useful when | Cost / risk | Mitigation or alternative |
|---|---|---|---|
| Raw bridges + remote DAQ | Electronics must stay off the tool | Low-level cabling, AFE design, calibration and validation effort | Shorten analog runs or use a documented remote conditioning box. |
| Near-sensor digitization | Cable EMI dominates | Packaging, power, heat and environmental qualification | Prove thermal/mechanical effects and transport latency before integration. |
| Uniform multiplexed acquisition | Signals are slow relative to the scan | Settling and time skew can exceed the error budget | Measure true scan timing; use faster burst scans or simultaneous sampling. |
| Simultaneous multi-channel ADC | Dynamic channel alignment is critical | Reference, filters, clocking and channel costs remain | Audit aperture matching and complete acquisition-to-output latency. |
Quotes must include the sensor, conditioning, DAQ channels, excitation supply, cable/connectors, mounting, calibration, firmware and acceptance tests. Prices and lead times are unknown here. A lower converter price may increase integration and recalibration work; compare the complete accepted chain.
Misuse risk: electrical headroom does not protect the flexure from overload. Scenario mismatch: a static fixture and a contact controller need different timing/error budgets. EMI risk: grounding and shield terminations depend on chassis bonding, frequency and installation; follow the equipment wiring instructions and test the installed system rather than imposing a universal single-end shield rule.
For existing interface families start with the interface overview. All HexaForce analog features and compatibility remain configuration targets until confirmed in writing; this page does not establish a tested SKU or driver.
This is an original planning protocol. Agree measurable limits, test equipment uncertainty and allowable loads before testing; no universal release thresholds are imposed. Retain the actual configuration, raw logs, scripts and pass/fail evidence.
| Measurand | Unit / context | Limit to agree | Evidence to retain |
|---|---|---|---|
| Bridge-end excitation | V under full harness load | Supplier excitation range and permitted variation | DMM uncertainty, current and measured voltage |
| Zero drift and output noise | N / N·m; stated bandwidth and temperature | Application-specific; unknown until agreed | Raw and decoupled logs plus thermal history |
| Dynamic timing | µs channel skew, latency and jitter | Phase / age budget for the intended task | Clock/filter settings and worst-case timing captures |
| Mechanical residuals | Each output axis at stated applied loads | Calibration uncertainty and agreed off-axis limits | Traceable load records, matrix revision and residuals |
For vehicle crash-test transducers, ISO 21612:2021 scope describes a procedure for crosstalk comparability in that field. The public scope does not establish a general robotics certification, a universal crosstalk limit, or conformity of this checklist.
References checked on 2 November 2026. Links support the stated circuit concepts and scope; component documentation is not evidence of tested HexaForce integration. The calculations, cases and bench checklist on this page are our declared planning model.
Still to obtain for your chain: maximum excitation, actual bridge topology/sensitivity, complete pinout, AFE/ADC/reference compatibility, measured noise and thermal drift, calibration matrix and uncertainty, actual scan/filter timing, firmware versions and end-to-end latency. Send these with the sizing summary to make the review actionable.
Both exist. This calculator models raw full-bridge millivolt signals followed by an AFE and ADC. For an already conditioned ±5 V output, use its specified scaling and input requirements; do not add the bridge gain again.
No. They are illustrative identical-bridge inputs. Obtain the sensor excitation limit, bridge resistance, sensitivity, pinout and calibration record before hardware selection. No model-specific analog interface is verified here.
No. Six axes usually require six independent signal channels. Four-wire and six-wire here describe an individual bridge connection. Shared excitation, sense pairs, shields and the actual connector allocation must be confirmed from the complete pinout.
Do not substitute a nearby value for a release decision. Send the datasheet, actual cable resistance, timing and required uncertainty to engineering. The fixed options define the supported illustrative model; invalid URL values withhold the result.
No. Nominal output occupies 1/1.5 = 66.7% of the ADC peak limit, leaving 33.3% unused. It allows a 50% increase relative to the nominal input only if offsets, AFE rails and mechanical limits allow it.
No. Active regulation needs current capacity, voltage compliance and stable feedback. Sense-based reference correction is a different implementation. Both require verification of reference limits, wiring, settling and residual error.
Six equal bridges in parallel load a common excitation pair at Rbridge/6. Independent pairs each supply one bridge at Rbridge. The shared pair carries six times the nominal current for the same bridge voltage and resistance.
It can be considered for sufficiently slow signals or a faster burst scan with characterized settling and alignment. The calculator assumes a uniform scan spread over the whole frame; use actual channel timestamps for a design decision.
At the baseband Nyquist boundary an arbitrary signal phase cannot be reliably recovered. Practical filters also need transition bandwidth. Choose a higher per-channel rate and verify the complete anti-alias response.
No. It includes only bridge Johnson noise and ideal quantization for a nominal-load sine. AFE and ADC internal noise, distortion, drift, EMI, matrix amplification and calibration uncertainty remain unknown.
Ordinary frame timestamps do not establish aperture matching at that scale. Use the ADC timing specification and a suitable synchronized test source, clock observation or phase test with an uncertainty analysis.
No. It is an original project planning checklist with application-specific acceptance limits to be agreed in advance. ISO 21612:2021 addresses vehicle-test load-cell crosstalk; citing its public scope does not demonstrate conformance.
DEFINE THE COMPLETE LOAD CASE
Include your six-channel loads, robot model, space envelope and preferred interface. Request a configuration-specific quotation and STEP drawing.